
In this article, I’ll show you how to program linear regression from scratch in Python using ONLY MATH.
Let’s get started.
Table of Contents
Why is coding linear regression from scratch useful?
When I study a new machine learning model, I always get lost between the formulas and the theory that I don’t understand how the algorithm actually works.
And there is no better way to understand an algorithm than to write it from 0, without any help or starting point.
Disclaimer
I have already written an article that discusses linear regression thoroughly, explaining the mathematical concepts and steps of the algorithm with pictures and examples.
I suggest you read it before continuing.
Linear regression from scratch in Python
Problem statement
We want to solve a regression problem with only numerical features by fitting a linear regression model to the data.
1. Import necessary libraries
import matplotlib.pyplot as pyplot
As you can see, my titles aren’t clickbait.
In this code, I use only matplotlib only to display graphically my model.
2. Define the dataset
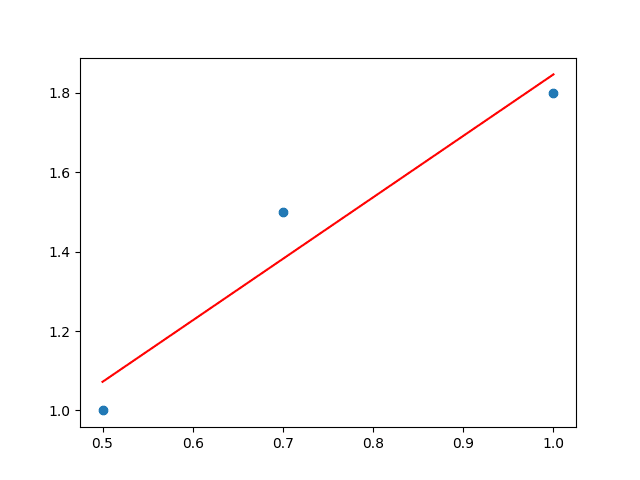
X = [0.5, 0.7, 1]

Y = [1, 1.5, 1.8]

N = len(X)
I use a dictionary structure to store my dataset about house prices.
3. Initialize the parameters
slope = 0

intercept = 0
4. Set the hyperparameters
learning_rate = 0.01

max_steps = 1000
The learning rate regulates the size of the parameters update and the max steps the number of iterations.
5. Update the parameters using gradient descent
for i in range(max_steps):
    w_derivatives = 0

    b_derivatives = 0

    for index in range(N):
        x = X[index]
        y = Y[index]

        w_derivatives += 2/N * -x * (y - (slope * x + intercept))
        b_derivatives += 2/N * -1 * (y - (slope * x + intercept))

    slope -= w_derivatives * learning_rate

    intercept -= b_derivatives  * learning_rate
This is the part where we train our model. It can be divided into 3 blocks.
5.1 (02 – 06)
In each iteration, we reset the 2 partial derivatives.
The partial derivatives describe how the error function E changes when w and b increase.
5.2 (07 – 13)
We calculate the partial derivatives at each data point and store them in the previous variables.
5.3 (14 – 17)
We minimize the Error by making little updates to w and b.
These updates are given by subtracting the derivative times the learning rate.
If you don’t understand these operations, check the gradient descent article.
6. Display the model
pyplot.plot(X, [slope * x + intercept for x in X], "-r", X, Y, "o")

pyplot.show()
Plot both the dataset and the model we’ve trained.
Linear regression in Python full code
from matplotlib import pyplot

X = [0.5, 0.7, 1]

Y = [1, 1.5, 1.8]

N = len(X)


slope = 0

intercept = 0


learning_rate = 0.01

max_steps  = 10000


for i in range(max_steps):
    w_derivatives = 0

    b_derivatives = 0

    for index in range(N):
        x = X[index]
        y = Y[index]

        w_derivatives += 2/N * -x * (y - (slope * x + intercept))
        b_derivatives += 2/N * -1 * (y - (slope * x + intercept))

    slope -= w_derivatives * learning_rate

    intercept -= b_derivatives  * learning_rate


pyplot.plot(X, [slope * x + intercept for x in X], "-r", X, Y, "o")

pyplot.show()
