
I began to hear about artificial intelligence with the boom of ChatGPT and other programs to generate images, text and audio.
At that time I already had experience in programming, and I understood how a computer was only a simple calculator, interpreting our instructions into numbers and executing them.
I could not understand how machines so closely related to mathematics and numbers could do magnificent things like write, draw, and talk like a human being.
After I began to study machine learning, which studies the development of such programs, I realized that “artificial intelligence does not exist”.
There aren’t conscientious machines acting on their own, but only programs that through mathematical processes can extract patterns in the large data they are trained on.
Table of Contents
The intent of this article
In this article, I want to give you an idea of how artificial intelligence learning can work, by studying the linear regression algorithm. I have not even fully covered this algorithm to make it easier for everyone to understand.
It is obvious that not all models behave the same way and are designed to solve the same problem.
This article’s ultimate goal is to intuitively teach you how AI works without “touching” math.
1. Creating a dataset
Let’s imagine that we are home sellers. Our goal is to find an accurate way to estimate the price of a new property given its size in m2.
We first take all the data from past sales and collect them into a table with 2 columns.
One column is the extension of the house in m2, and the second is the sale price.
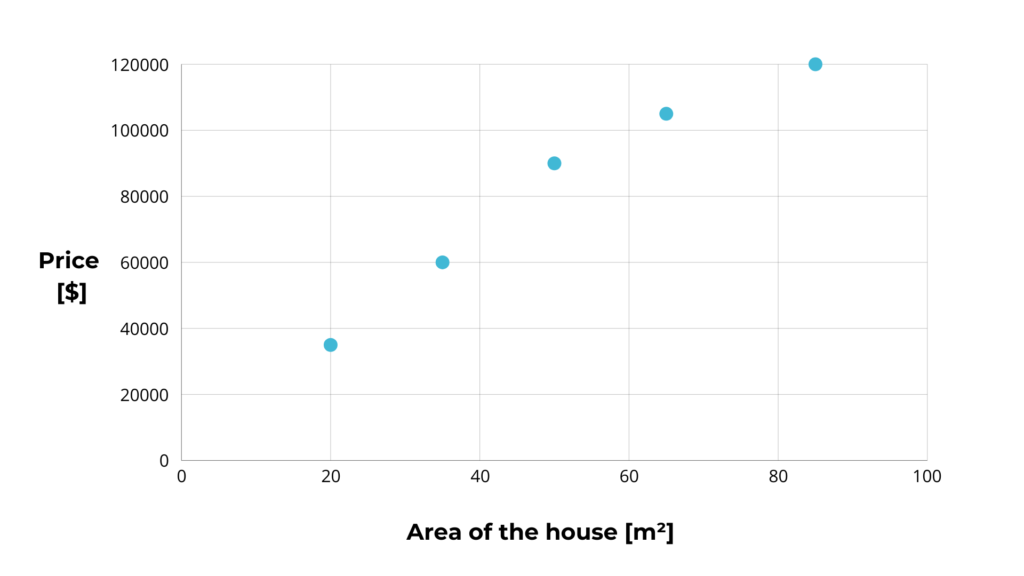
| Area [m2] | Price [$] |
|---|---|
| 20 | 35 000 |
| 30 | 60 000 |
| 50 | 90 000 |
| 65 | 105 000 |
| 85 | 120 000 |
Now, we display the table on a graph. The sale price is on the y-axis (y) because its value depends on the area. The latter is on the x-axis (x).
2. Training an AI model
We intend to represent the trend of the data, and we can do this by drawing a line. For each value of x on the x-axis, we draw the height to the line, which is the estimated value of y.
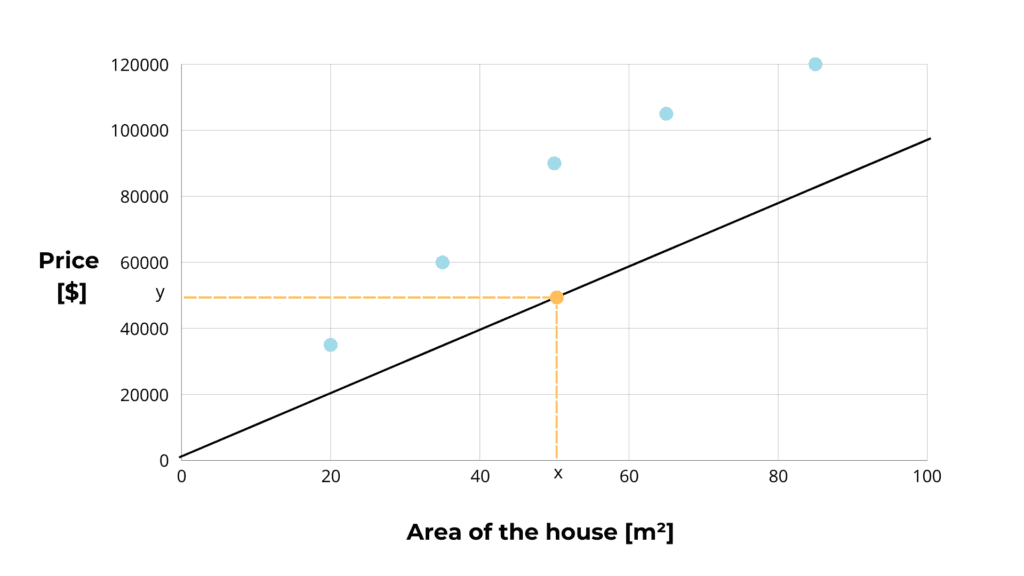
The problem is, how to draw this line?
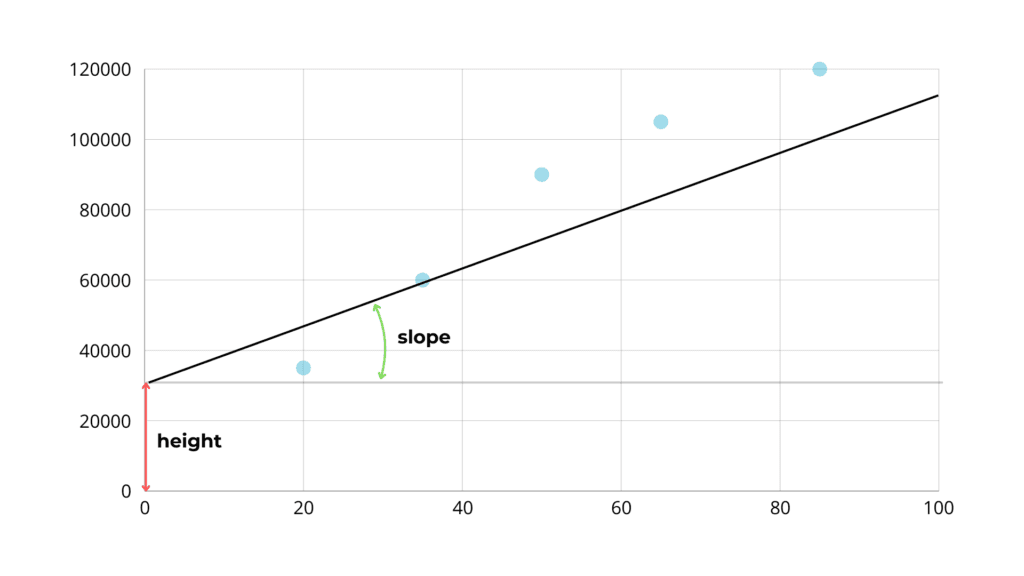
To be accurate, the line must be as close as possible to all the points on the plane so that the estimated values are similar to the true values.
To adjust our line, we can change its height and slope.
We start with a random line. In this case, to fit the dataset, we must gradually decrease the height and increase the slope.
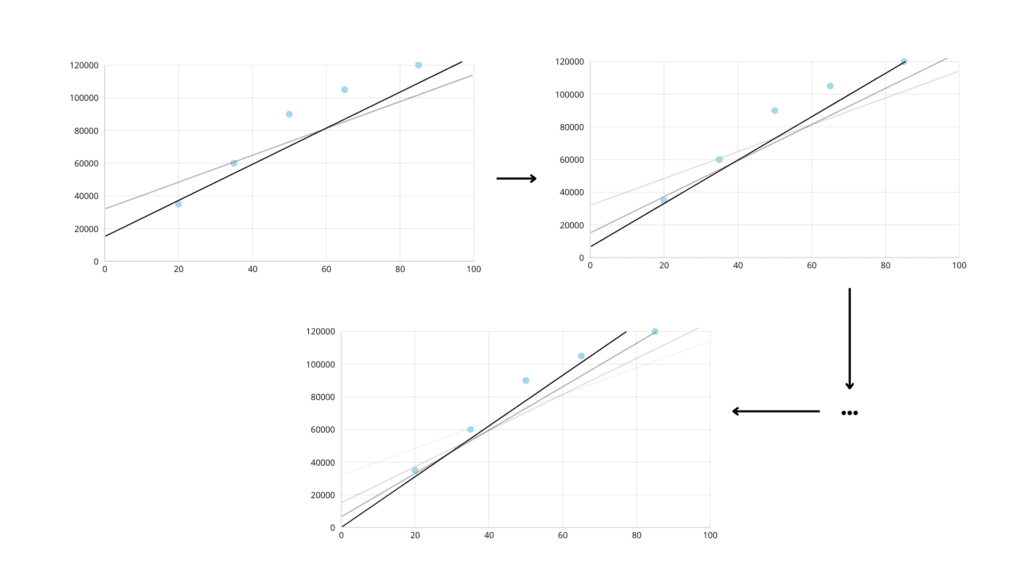
After some time and adjustment, we have achieved a good result.
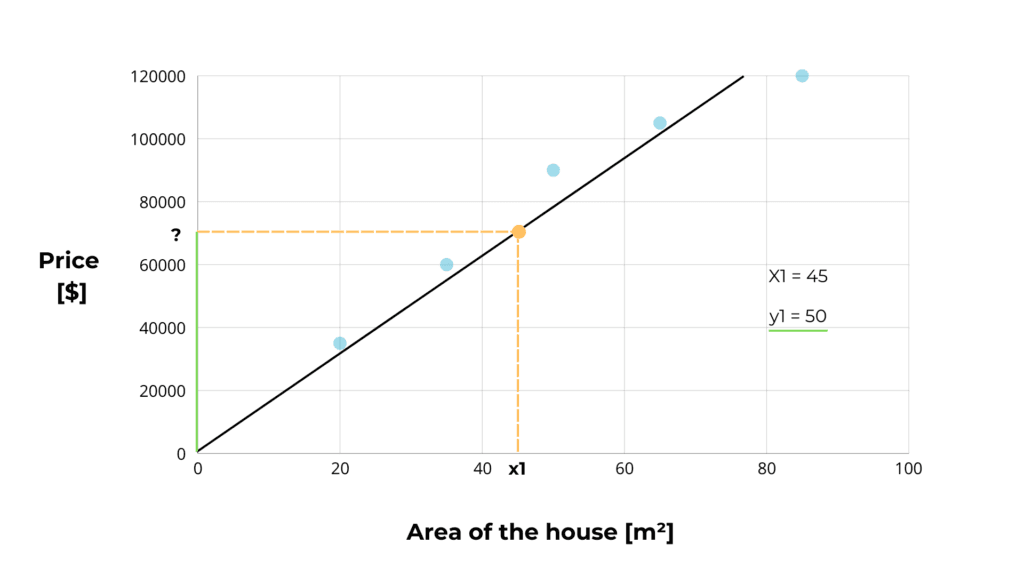
3. Predict unseen input values
Now, when we get a new house to sell, with an area value of x1, we simply plot the height from x1 until we get to our straight line. This height, on the y-axis, is the price of the house that our artificial intelligence has estimated!