In this article, I’ll show you how to program gradient descent from scratch in Python using ONLY MATH.
Let’s get started.
Table of Contents
Why is coding gradient descent from scratch useful?
When studying a new machine learning algorithm, I always get lost between the formulas and the theory, and I don’t understand how it works.
And there is no better way to understand an algorithm than to write it from 0, without any help or starting point.
Disclaimer
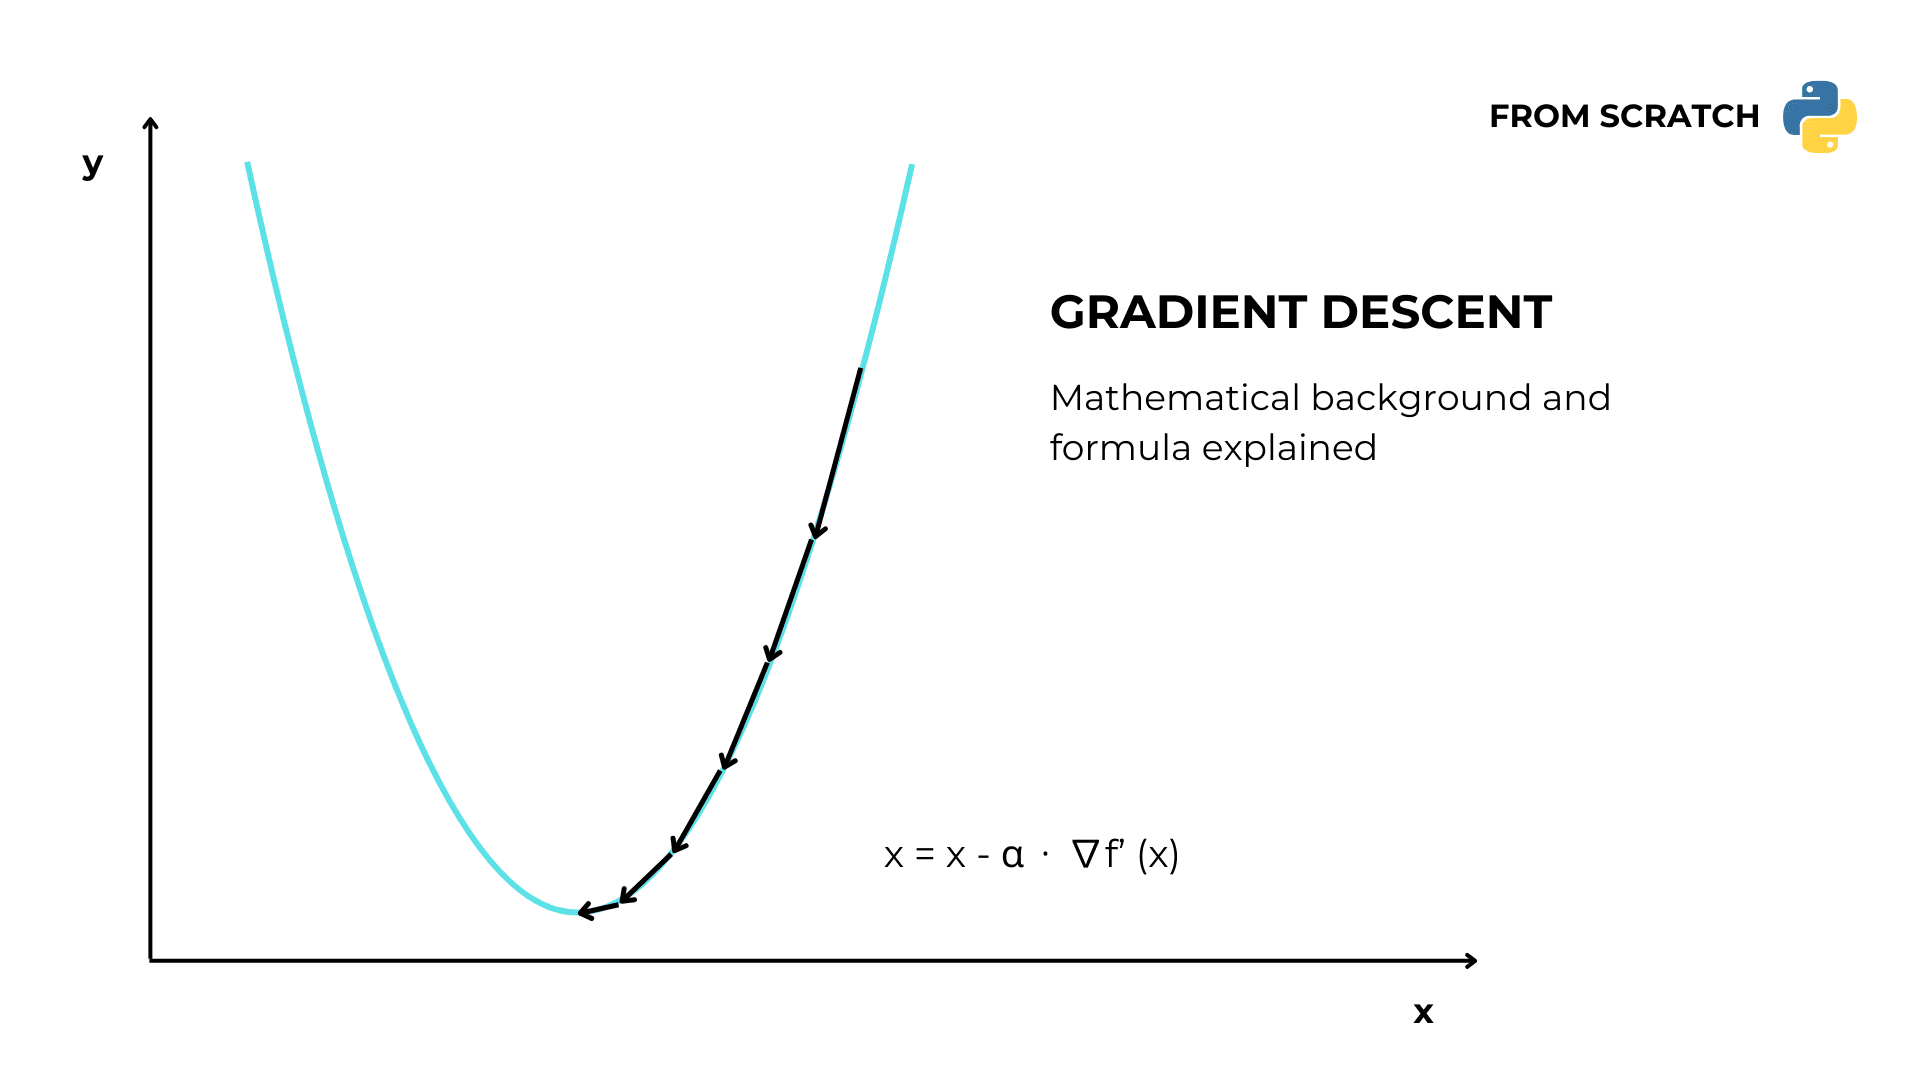
I have already written an article that thoroughly discusses gradient descent, explaining the algorithm’s mathematical concepts and steps with pictures and examples.
I suggest you read it before continuing.
Gradient descent in Python
Problem statement
We have a function f(x) = x² and we want to find the value of x for which y is as low as possible.
We can use the gradient descent algorithm to solve our task.
1. Import necessary libraries
from numpy import linspace, random

from matplotlib import pyplot
As you can see, my titles aren’t clickbait.
In this code, I use only numpy for random values and pyplot for plotting.
2. Define the function and the derivative
#return the y value of an input x
def f(x):
    return x ** 2

#return the derivative at an input point x
def derivative_f(x):
    return 2 * x
If you don’t understand what a derivative is, check my article about derivatives.
3. Define the function list
# lists for plotting

x_sample = linspace(-100, 100)

y_sample = f(x_sample)

pyplot.plot(x_sample, y_sample)
pyplot.show()
With the linespace function I create a list of 200 integer values ranging from -100 to 100, useful for displaying my function.
4. Start with an initial random value
x = random.randint(-100, 100)
5. Choose hyperparameters
# the size of the steps
learning_rate = 0.1

# when the algorithm stops iterating
n_iterations = 1000
6. Update the parameter
for i in range(n_iterations):
    #update the parameter going towards the local minimum
    x -= learning_rate * derivative_f(x)

    pyplot.plot(x_sample, y_sample, f(x), "o")
    pyplot.show()
Gradient descent full code
from numpy import linspace, random

from matplotlib import pyplot


#return the y value of an input x
def f(x):
    return x ** 2

#return the derivative at an input point x
def derivative_f(x):
    return 2 * x


# arrays for plotting

x_sample = linspace(-100, 100)

y_sample = f(x_sample)

pyplot.plot(x_sample, y_sample)
pyplot.show()


# initialize x with a random value

x = random.randint(-100, 100)


# hyperparameters

# the size of the steps
learning_rate = 0.1

# number of updates
n_iterations = 1000


for i in range(n_iterations):
    #update the parameter going towards the local minimum
    x -= learning_rate * derivative_f(x)

    pyplot.plot(x_sample, y_sample, f(x), "o")
    pyplot.show()


