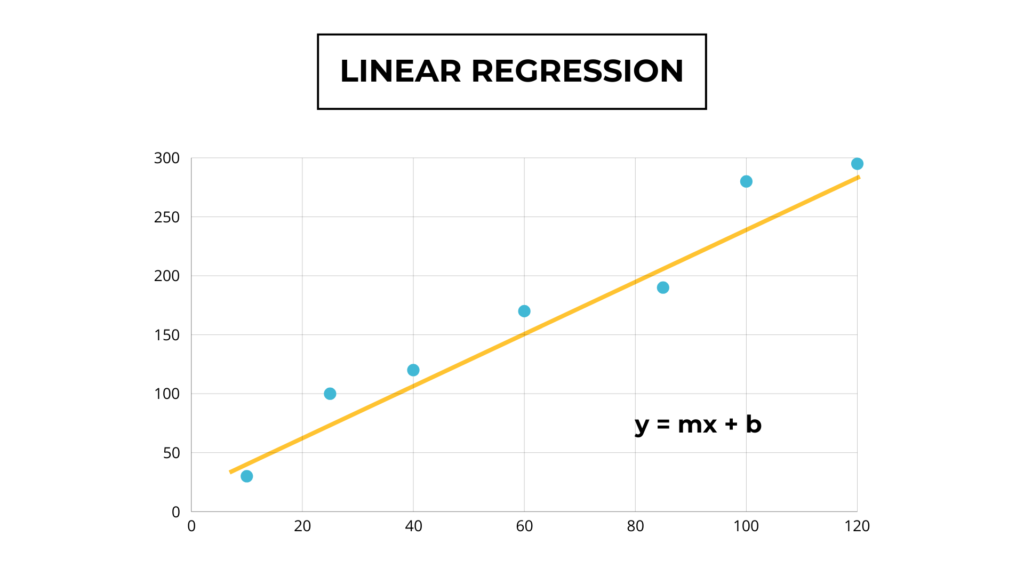
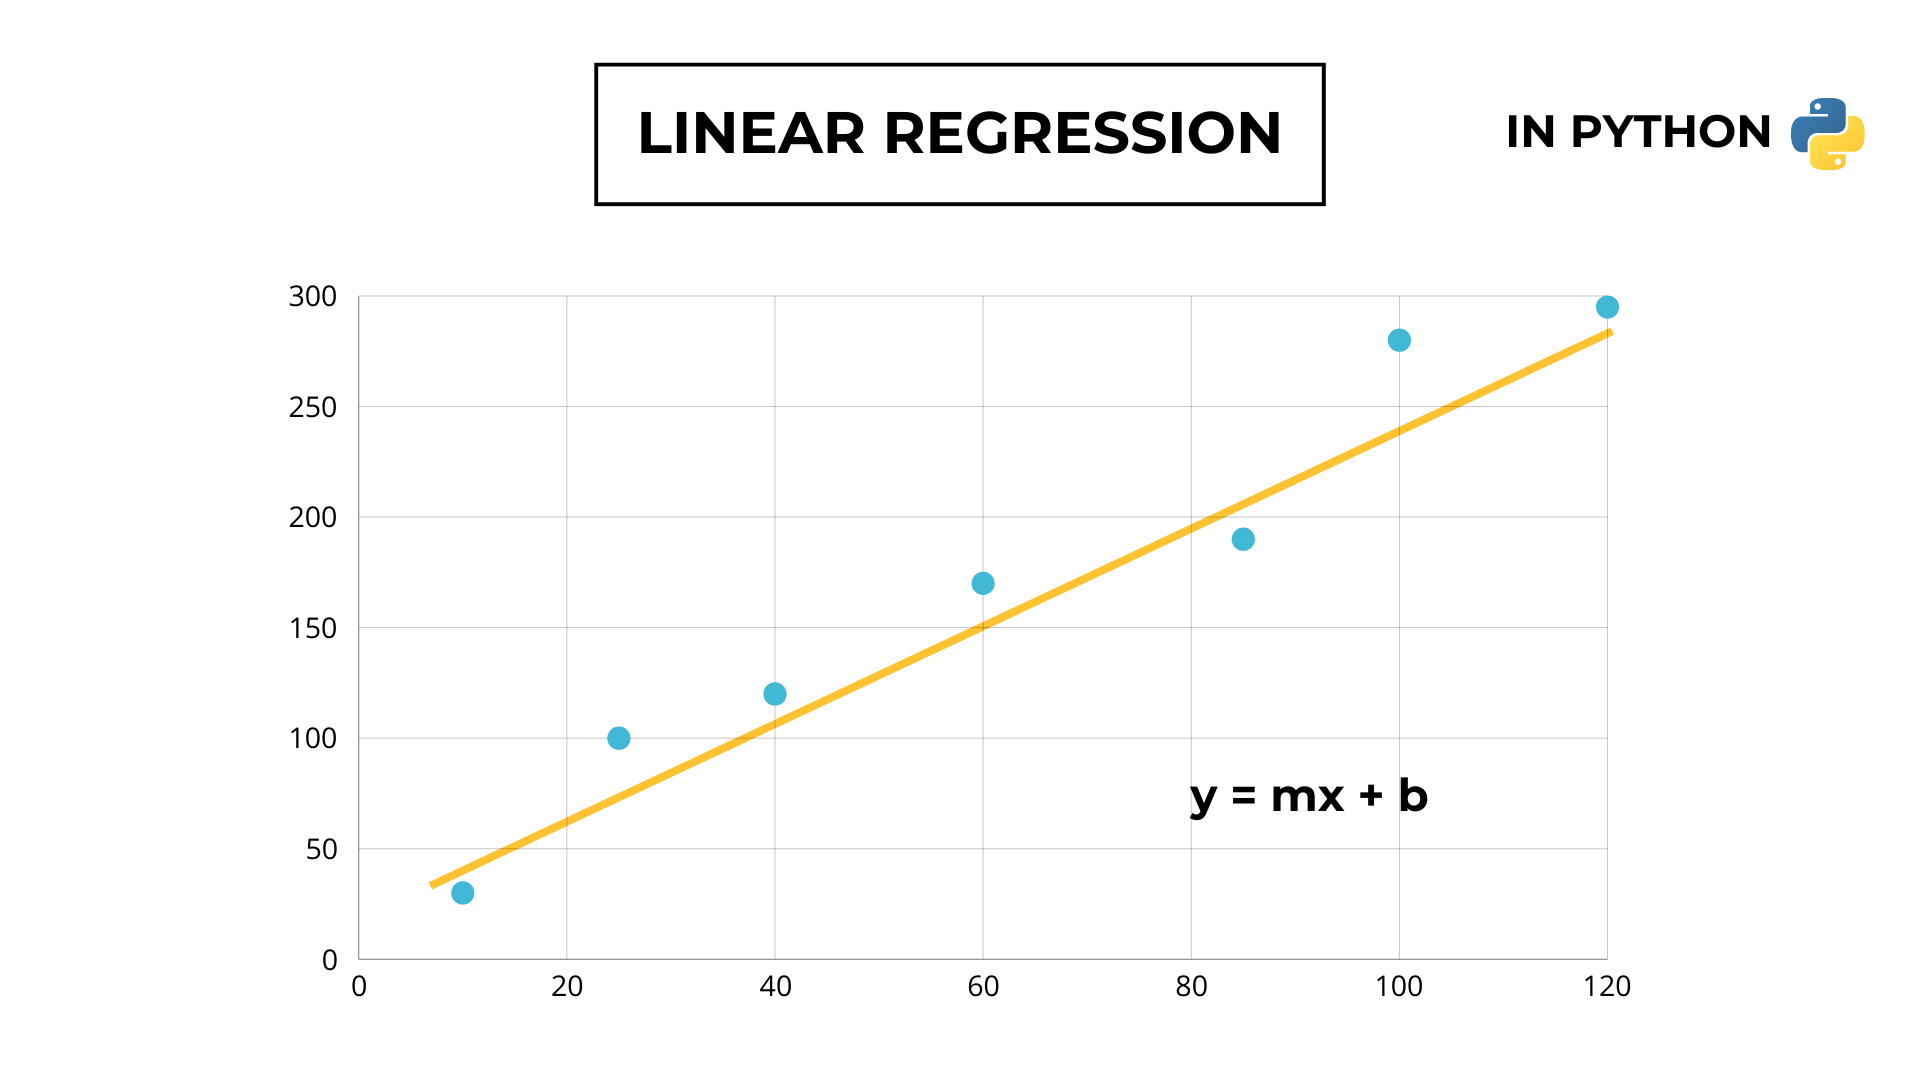
In this article, I’ll show you how to program linear regression in Python using ONLY MATH. In this way, I will help you understand how this algorithm works deep down.
Let’s get started.
Table of Contents
Disclaimer
I have already written an article that discusses linear regression thoroughly, explaining the mathematical concepts and steps of the algorithm with pictures and examples.
I suggest you read it before continuing.
Decision tree in Python
Problem statement
We want to solve a regression problem with only numerical features by fitting a decision tree to the data.
1. Import necessary libraries
import numpy

import matplotlib.pyplot as pyplot
In this code, I only use Numpy, a library useful for dealing with lists and matplotlib to plot my data and model.
2. Define a dataset
train_X = {
    "LotArea":[50, 70, 100],
}

train_y = {
    "SalePrice":[100, 105, 180]
}
I use a dictionary structure to store my dataset about house prices.
3. Initialize the parameters
slope = 0

intercept = 0
4. Set the hyperparameters
learning_rate = 0.0001

max_steps = 100
The learning rate regulates the size of the parameters update and the max steps the number of iterations.
5. Update the parameters using gradient descent
for i in range(max_steps):

    w_derivatives = 0

    b_derivatives = 0

    for l in range(len(train_X["Area"])):
        x = train_X["Area"][l]
        y = train_y["Price"][l]
        N = len(train_X["Area"])

        w_derivatives += 2/N * -x * (y - (slope * x + intercept))
        b_derivatives += 2/N * -1 * (y - (slope * x + intercept))

    slope -= learning_rate * w_derivatives

    intercept -= learning_rate * b_derivatives
6. Display the line
pyplot.plot(train_X["Area"], [slope * x + intercept for x in train_X["Area"]],  train_X["Area"], train_y["Price"], "o")
pyplot.show()
Linear regression in Python full code
import numpy

import matplotlib.pyplot as pyplot

train_X = {
    "Area":[50, 70, 100]
}

train_y = {
    "Price":[100, 125, 200]
}

slope = 0

intercept = 0


learning_rate = 0.0001

max_steps = 100


for i in range(max_steps):

    w_derivatives = 0

    b_derivatives = 0

    for l in range(len(train_X["Area"])):
        x = train_X["Area"][l]
        y = train_y["Price"][l]
        N = len(train_X["Area"])

        w_derivatives += 2/N * -x * (y - (slope * x + intercept))
        b_derivatives += 2/N * -1 * (y - (slope * x + intercept))

    slope -= learning_rate * w_derivatives

    intercept -= learning_rate * b_derivatives

pyplot.plot(train_X["Area"], [slope * x + intercept for x in train_X["Area"]],  train_X["Area"], train_y["Price"], "o")
pyplot.show()